Ben Suliteanu is an aspiring filmmaker specializing in editing and sound design. He recently graduated from Stanford University with a bachelor’s degree in science, technology, and society.
Space technology has given us a wider perspective of our place within the universe, but these satellite-captured time-lapse videos bring our gaze in a bit closer, revealing the profound impact we are having on our planet.
It is difficult to imagine how humanity envisioned Earth before our first view of it from space. Before astronauts, before satellites equipped with high-resolution cameras, conceptions of what our planet looked like from the outside existed only in the imagination.
Did people imagine how deep the blue of the oceans would appear against the backdrop of an infinite blackness? Did they know continents would be visible in a single glance, city lights illuminating our distant habitations?
As the space race unfolded throughout the ’50s and ’60s, the international public sat enraptured in front of their televisions, watching the latest rocket speeding toward the heavens. People looked up at the night sky with new wonder. There were now astronauts looking back.
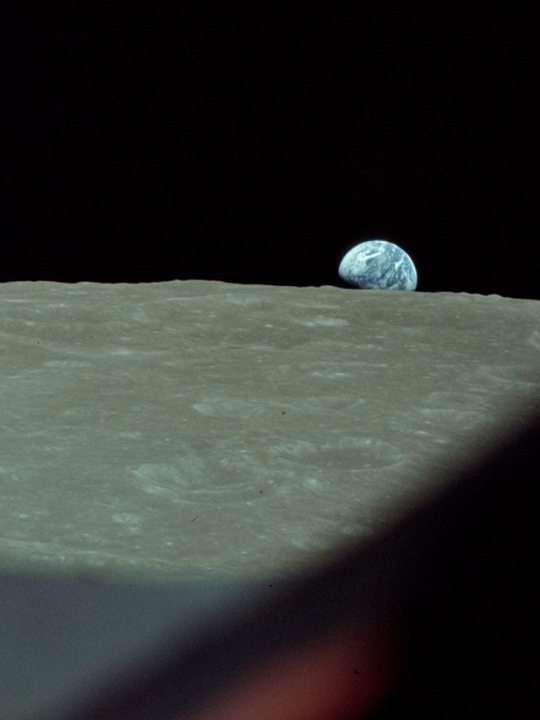
The December 24, 1968, broadcast of the Apollo 8 mission was the most widely watched television program of its time. The entire world held its breath as three men prepared to accomplish a feat that had never been attempted before: a pass around the moon, 240,000 miles from home.
Bill Anders looked out a small window of the spacecraft as Earth disappeared from view behind the moon. He pulled out his Hasselblad medium format camera, loaded a roll of black-and-white film, and began to take photos of craters on the far side of the moon.
For hours, crater after colorless, gray crater passed. And then, light. Radiant blue. The Earth, barely larger than Anders’s thumbnail, was rising over the surface of the moon. He loaded a roll of color and released the shutter.
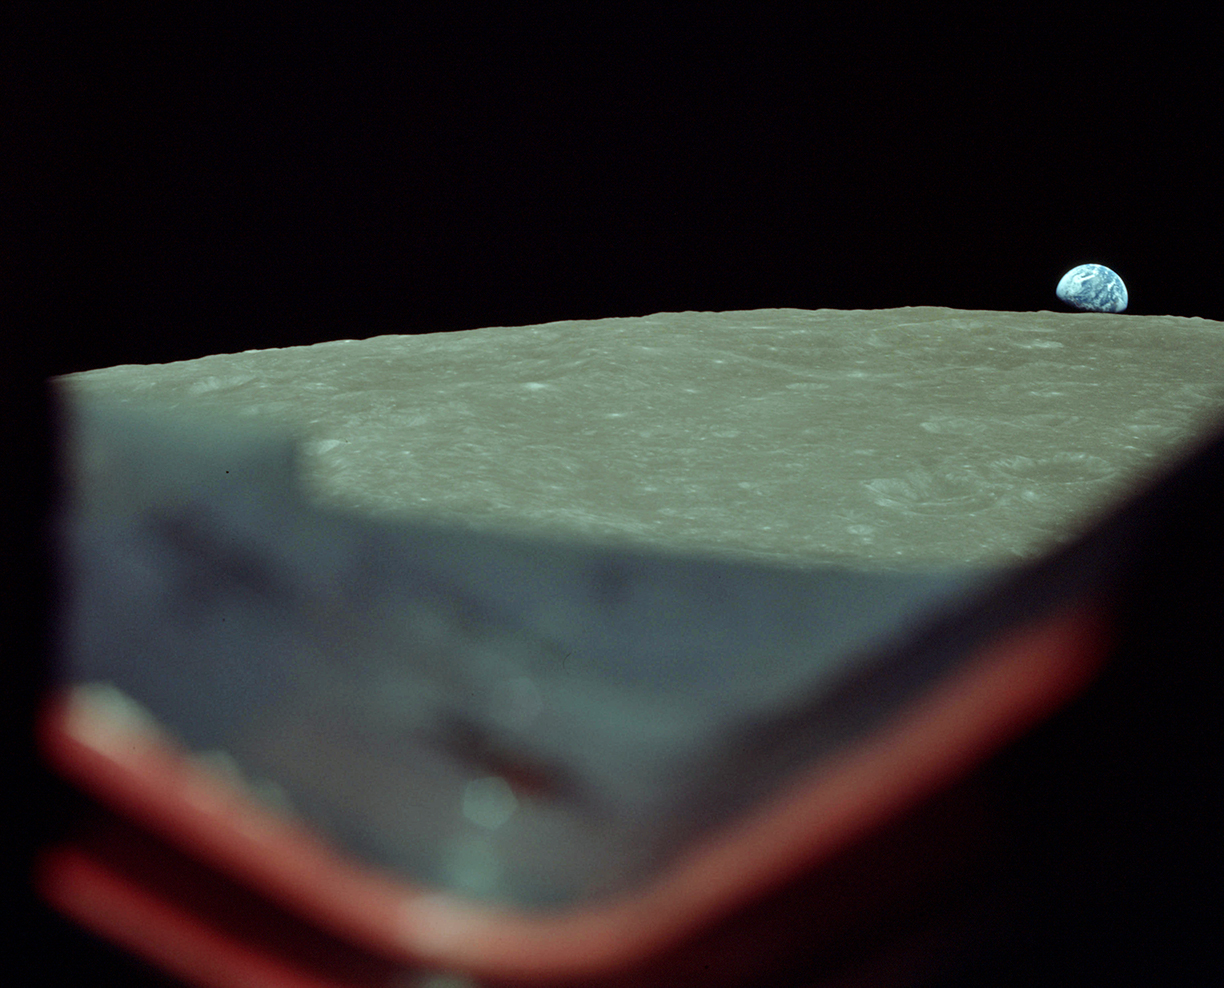
Bill Anders of the Apollo 8 mission looked out a side window of the spacecraft and saw Earth rising over the moon’s horizon.
Photo credit: NASA
Those who saw the photo were invited into a new perspective. Never before had we seen Earth so small, so distant, so fragile. “We’re just a small piece of an almost infinite universe,” Anders said in reflection. With that distance came a feeling of longing. As mission commander Frank Borman put it, “Everything we held dear was back on that blue planet.”
For Stewart Udall, who was the U.S. Secretary of the Interior at the time and an early pioneer of the conservation movement, it was an affirmation. This image communicated simply and powerfully what had become his life’s mission to impart: Earth, beautiful and whole, is worth protecting.
The Earthrise photo also came at a convenient time for Udall, who, along with US Geological Survey Director William Pecora, was fighting a political battle for the approval of their own space photography mission.
Unlike the Earthrise photograph, they wanted a closer view of the land. And it wasn’t a single image that they were after, but rather a continuous collection of images from an orbital vantage, which they could use to survey, manage, and observe changes in Earth’s resources over time.
The mission, later named Landsat, involved launching a series of satellites with high-resolution scanners that would continuously record and send back images of whatever they hovered over. Following polar orbits, the satellites could document all of Earth’s landmass, returning to the same location about every two weeks.
With the aid of this beyond-bird’s-eye view, Udall and Pecora believed that water supplies could be managed, urban growth could be quantified, forests could be inventoried, oil spills could be tracked, and maps could be drawn with high precision. They were certain it would be a revolution in remote sensing—scanning the earth by satellite in order to obtain information about it.
After the mission’s proposal in 1965, Udall followed with a spurring press release, hoping to quickly get it off the ground: “The time is now right and urgent to apply space technology towards the solution of many pressing natural resources problems being compounded by population and industrial growth.”
However, the Bureau of Budget lacked Udall’s sense of urgency, countering that high-flying aircrafts were the fiscally responsible choice for this kind of work. The proposal remained in the doldrums for several years.
The tide turned in the late ’60s, following the Earthrise photograph of 1968 and the lunar landing of 1969. Positive sentiment for space-bound missions was at an all-time high, and by 1970, NASA had the green light to begin construction on Earth Resources Technology Satellite 1, later renamed Landsat 1, which launched on July 23, 1972.
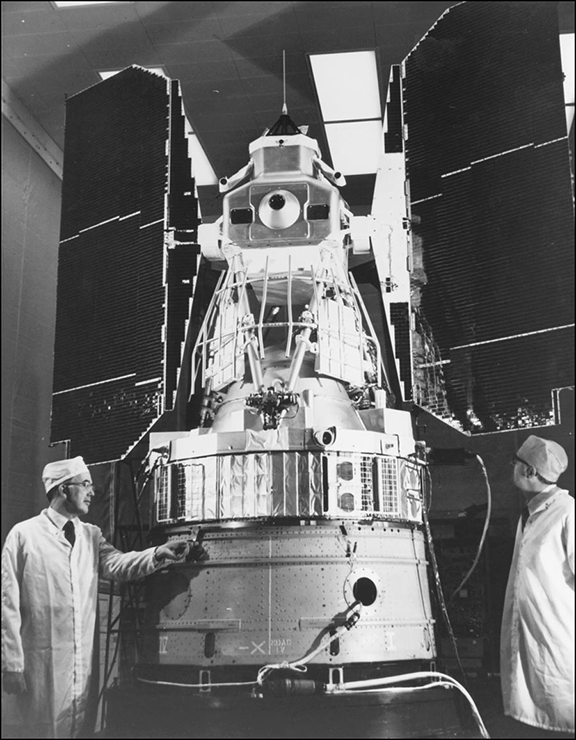
Earth Resources Technology Satellite 1, later renamed Landsat 1, being tested in a clean room before launch.
Photo credit: NASA
In the decades since, many other remote-sensing satellite missions have been deployed. None have been as continuous as Landsat. When Landsat 1 failed and was decommissioned, Landsat 2 was already in orbit and transmitting.
Now on its eighth mission, Landsat has collected over forty years of data in the USGS database, which was made freely available to the international public in 2012. As a way of making this data more accessible, Google recently launched their Timelapse tool, an interactive map that stitches together time-lapse videos created from global Landsat imagery.
These videos, which span only the last few decades, show glaciers receding, forests being leveled, megacities blooming, and mines expanding. While the Earthrise photograph captured a radiant blue marble, pristine against the black curtain of space, these closer perspectives show us perhaps more than we wanted to know in our desire to see Earth from above: humanity’s destructive impact on our planet.
Ice
We begin in a place with deep historical ties to the Landsat mission, the far northeastern coast of Canada. Here, ice-capped mountainous islands are separated by glacially-carved arctic channels, forming what is commonly known as the Labrador Islands, which include Glover Island, Bell Island, Fogo Island, Killiniq Island, Home Island, and the only island ever named after a satellite, Landsat Island, officially mapped in 1976.
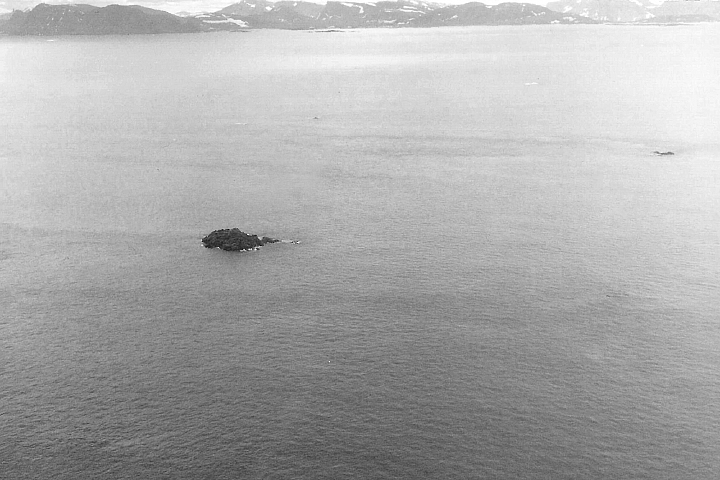
The only island named after a satellite: Landsat Island.
Photo credit: NASA
In 1973, topographic researcher Betty Fleming was inspecting images of the mostly-uncharted Labrador coast, looking for islands. She had an interest in Landsat’s ability to find small features, and in her surveys that year, she spotted the 25-by-45-meter island, which was barely more than a few pixels in the scan. It wasn’t much, but after seeing the white specs consistently appear in the same location, Fleming was confident that these were permanent features and passed the news on to the Canadian Hydrographic Service, who would physically verify its existence.
They dispatched geologist Dr. Frank Hall to be the first person in modern history to set foot on the island. Dr. Hall describes being lowered from a helicopter onto the ice-covered rock, where a polar bear stood on its highest point, ready to swipe at him. He tugged on the line to be pulled up.
Dr. Hall brought his tales back to the Canadian Parliament, suggesting the name Polar Island. Ultimately, though, the nod was given to the artificial eye orbiting above.
Subsequent generations of Landsat satellites have kept watch over Landsat Island and the Labrador region. Time-lapses at these latitudes reveal some of the first clearly visible effects of global temperature rise. Rock that was once covered in ice and snow year-round is now exposed during summer months.
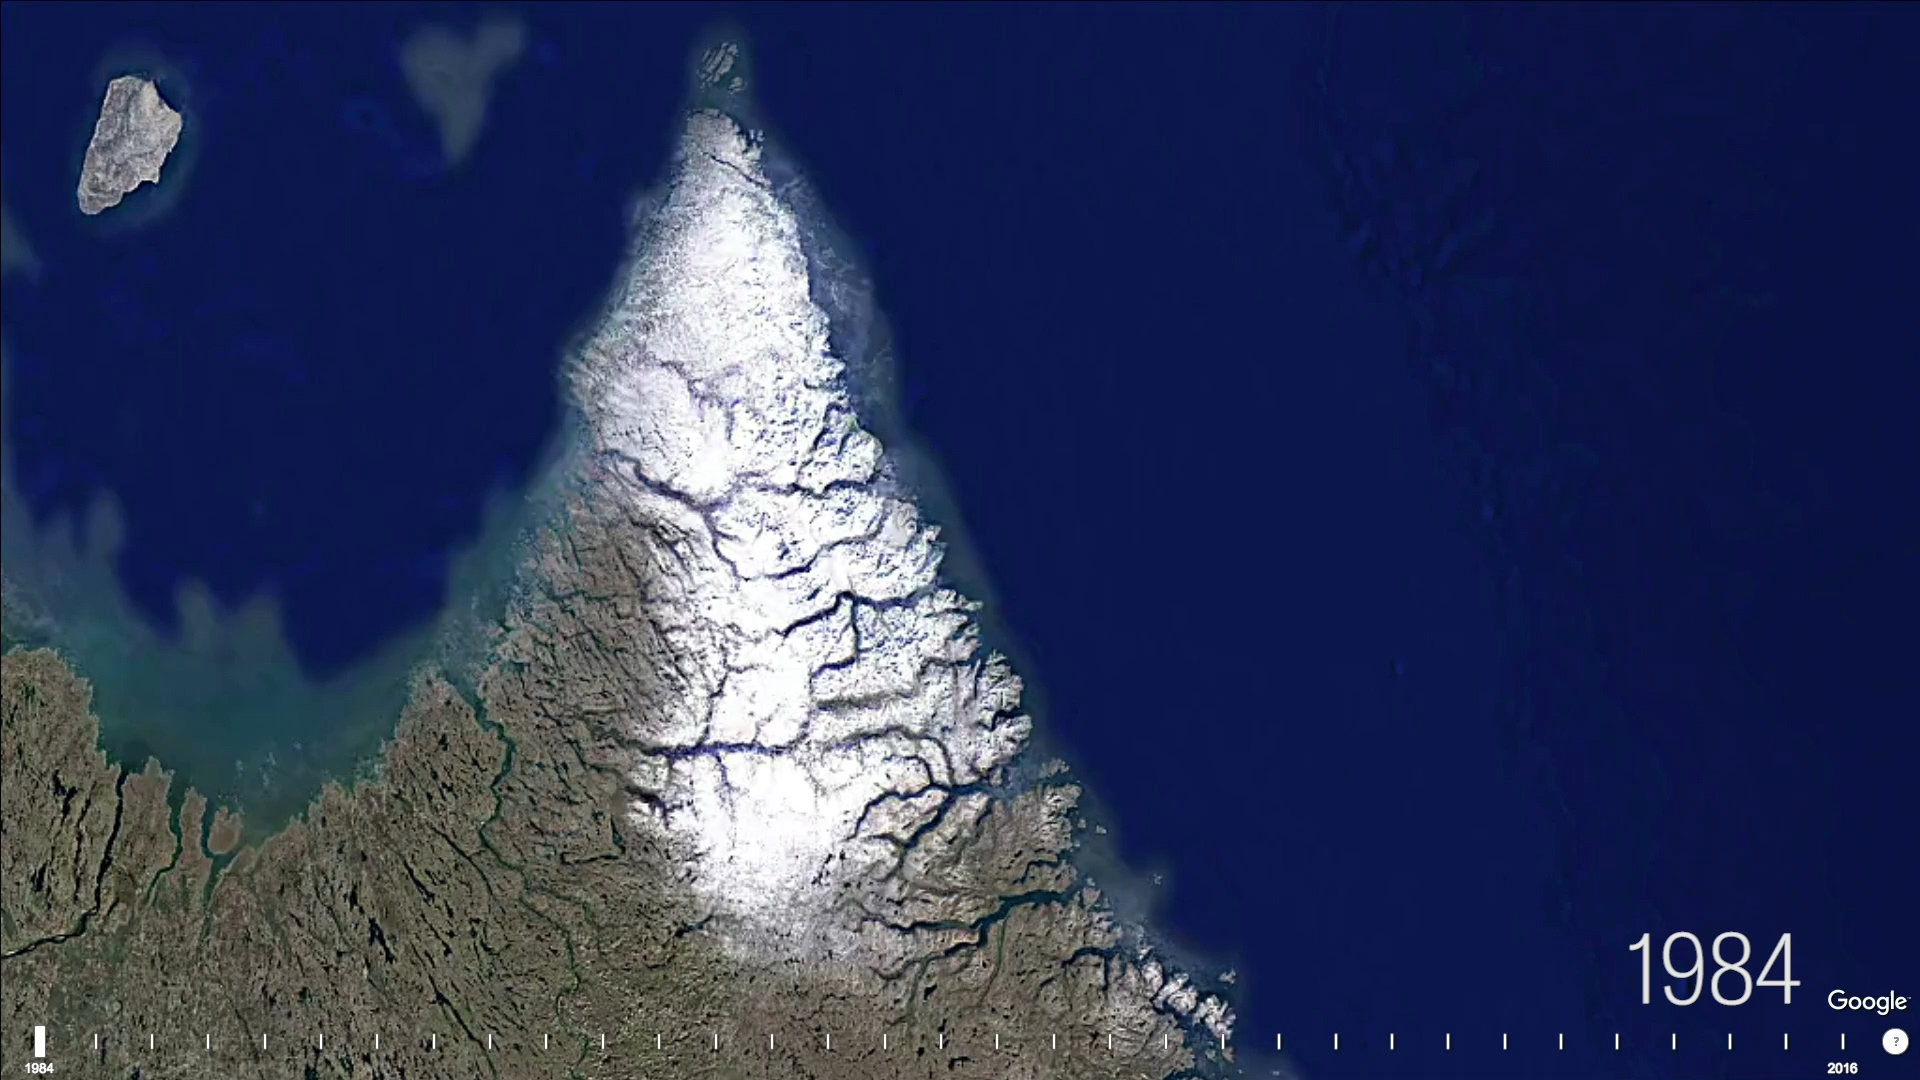
The Labrador Islands, northeastern Canada, 1984–2016.
Ice melt means rising sea levels: about three millimeters a year, according to the latest data (collected from satellite radar altimetry). As a result, coastlines are slowly being swallowed. Islands are shrinking.
With increasing rates of rising seas, Landsat Island, no more than a few meters tall, will eventually return to the sea.
Forest
Since 1978, over 750,000 square kilometers of Amazon rainforest have been destroyed. Nearly three-quarters of this has been slashed and burned to provide pasture for cattle ranchers, although small-scale subsistence agriculture, large-scale commercial agriculture, illegal logging, and mining also play significant roles.
For Brazil, Latin America’s largest holder of Amazon rainforest, annual deforestation rates rose throughout the late ’90s and the first few years of the twenty-first century, peaking at about 3.5 million hectares of forest destroyed in 2004, an area equivalent in size to the state of Maryland.
In this time-lapse in the western part of the state of Rondônia, Brazil, we see evidence of all the major factors of deforestation at play. Large swaths are cleared for cattle, smaller plots appear for family-based subsistence agriculture, and the two-thousand-hectare Bom Futuro (good future) tin mine is erected.
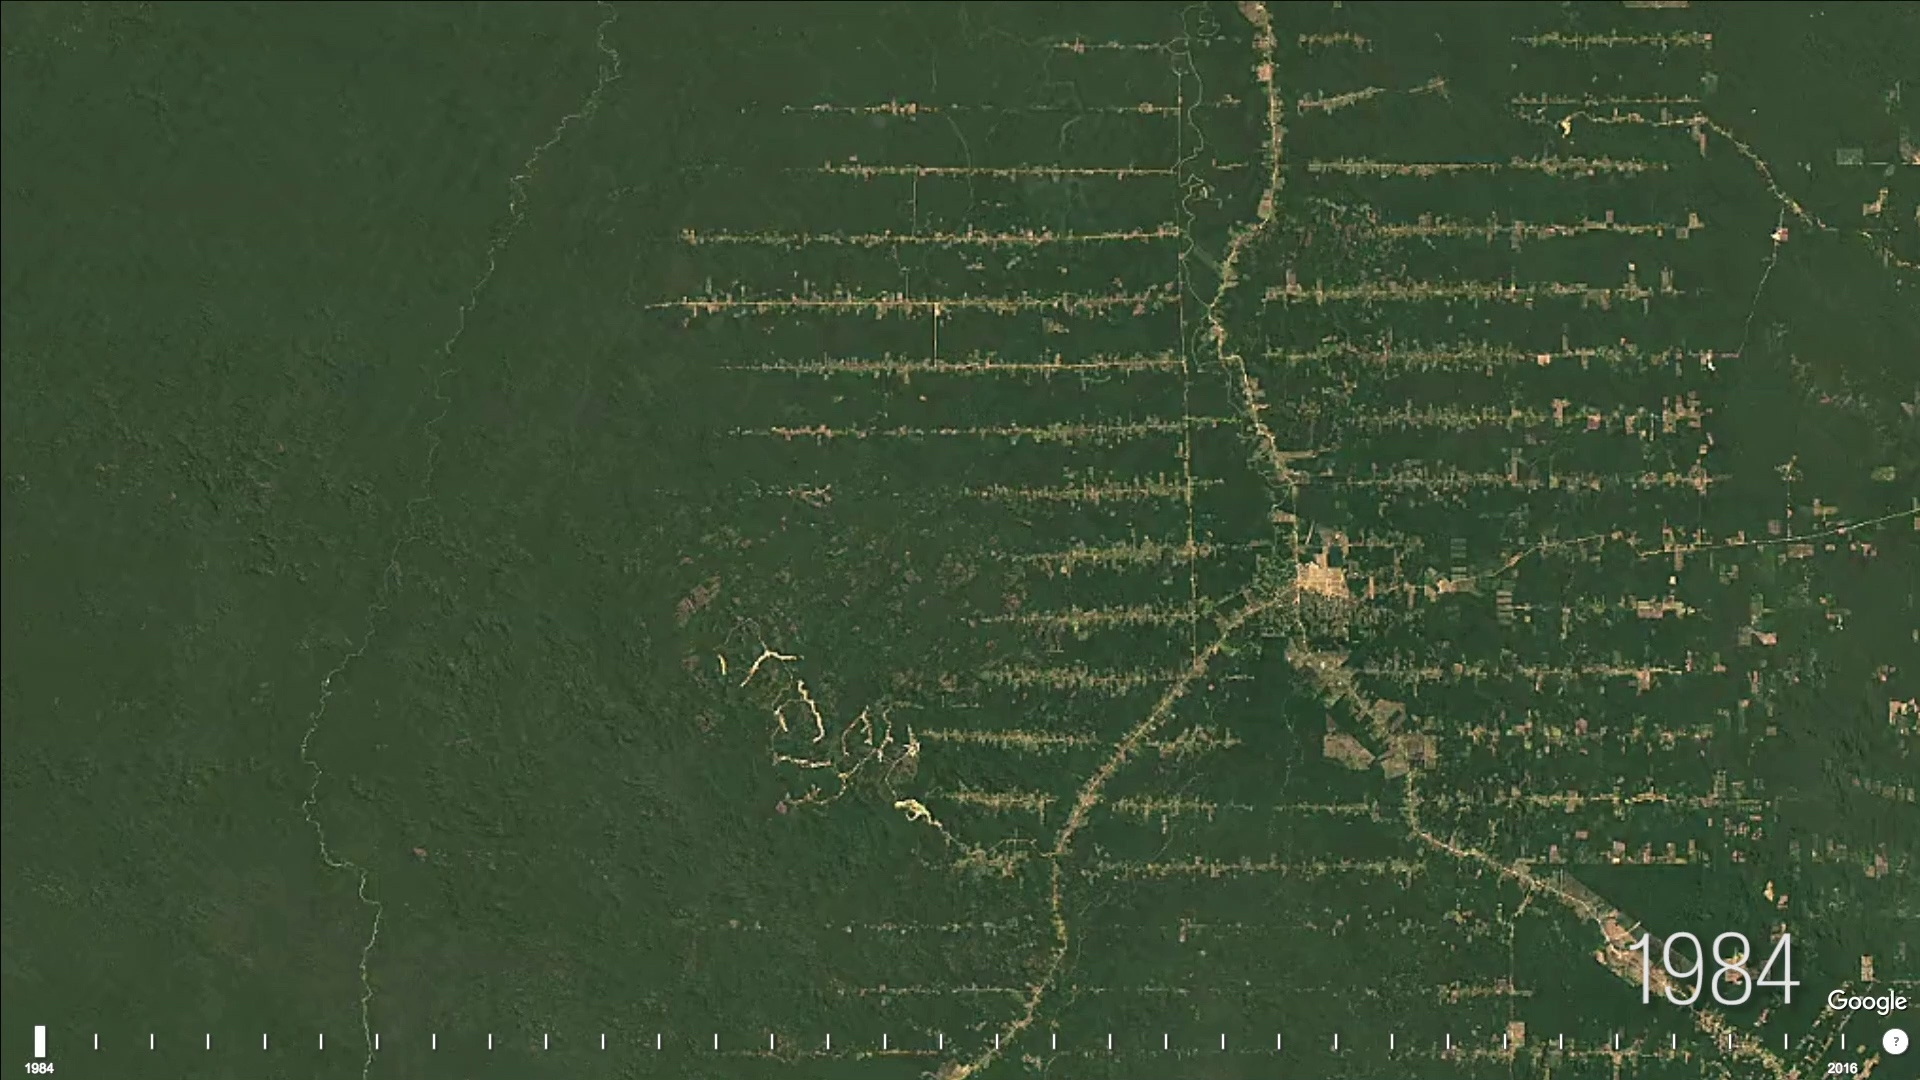
Amazon Rainforest, Rondônia, Brazil, 1984 2016.
These satellite images, which clearly show illegal destruction of forest, give Brazilian environmental police a powerful tool for curbing it.
Since their peak in 2004, deforestation rates have halved, primarily due to satellite intelligence. The Brazilian Ministry for Science and Technology has created a special initiative called DETER, a real-time deforestation detection service which receives and analyzes data from NASA’s Terra and Aqua satellites.
The system can detect deforestation of plots greater than six hectares. Cattle ranchers who once slashed and burned without fear of detection are now wary of the eye in the sky, especially on clear days when satellite visibility is good. Environmental police are quick to follow up on leads and institute fines, confiscating equipment.
However, continuing to lower deforestation rates will require higher resolution imagery, which Brazil’s National Institute of Space Research plans to invest in by designing their own specialized satellite. Plots for small-scale subsistence agriculture are currently less visible, so improved images could help to identify them; but more work would need to be done to regulate them, given that government programs have often allowed this type of expansion as a way of alleviating poverty.
Oil
While satellite tools have been powerful in policing deforestation in the Amazon, they have equally assisted mining developers in surveying sites to gauge their potential.
The Houston-based company Satellite Imaging Corporation touts accurate satellite imagery as “the most cost-effective method of oil exploration available to petroleum experts today.” By analyzing infrared bands of satellite images, oil surveyors can isolate terrain features which give hints of untapped crude reserves.
These techniques, along with seismic sensing technology, have led surveyors to estimate that approximately 1.7 trillion barrels worth of bitumen, a thick tar-like form of crude oil, lie beneath boreal forests and bogs in northern Alberta: Canada’s Athabasca Oil Sands (also known as the Tar Sands), the largest known oil reserves in the world.
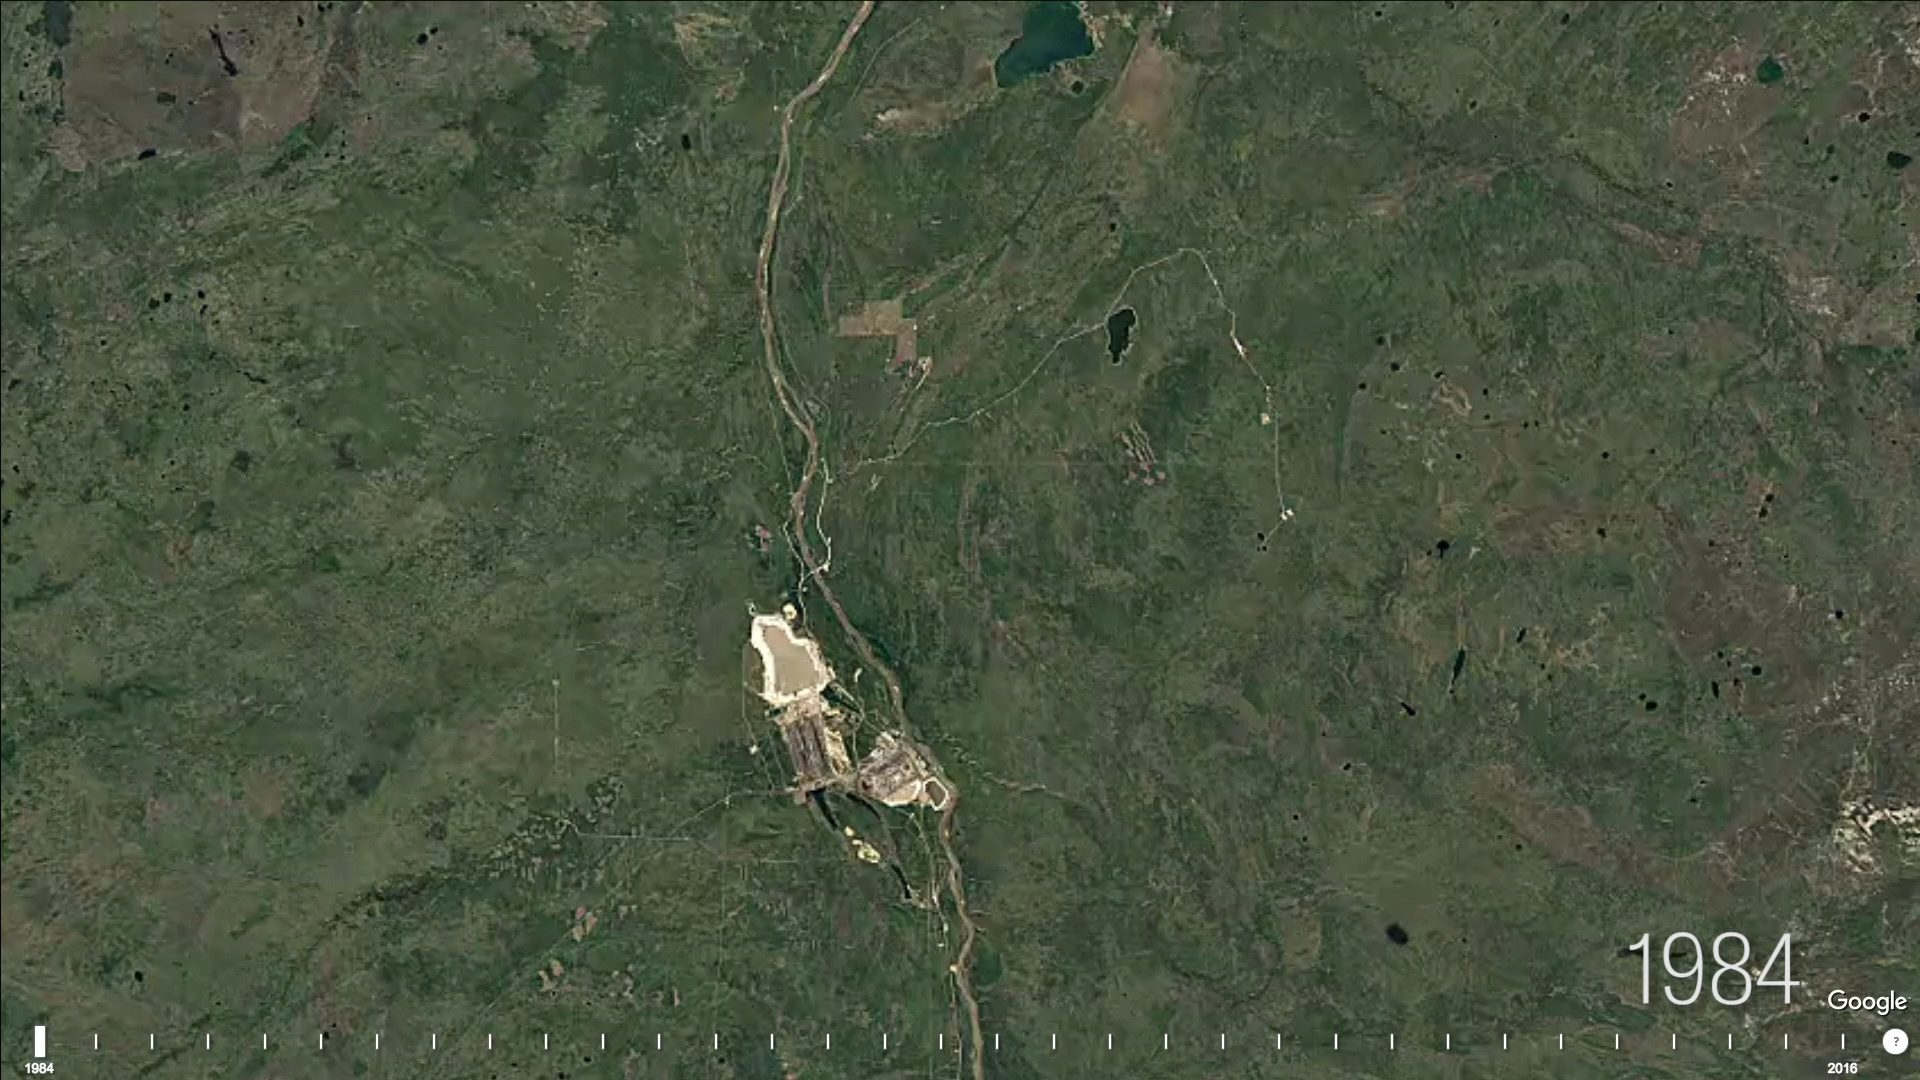
Fort McMurray, Alberta, Canada, 1984–2016.
Time-lapses of the area just north of Fort McMurray, Alberta, reveal the rapid digging of open-pit mines and the filling of their corresponding tailing ponds: toxic sludge deposits produced in the process of separating the bitumen from sand and soil. The area that these ponds cover has increased by a factor of ten in the last twenty years.
With no ceiling in sight for petroleum demand, Landsat and other satellite images will continue to be scoured by surveyors for signs of untapped pockets of crude.
Water
The release of Google Timelapse in 2016 was not met with particular fanfare in online media outlets. Google posted some of the most striking time-lapses on their YouTube channel, but only one received more than a million views. The drying of the Aral Sea, which lies between Kazakhstan and Uzbekistan, is perhaps the most visually dramatic environmental change that has occurred since the launch of Landsat 1. What was once the fourth-largest lake in the world is now known as the Aralkum Desert.
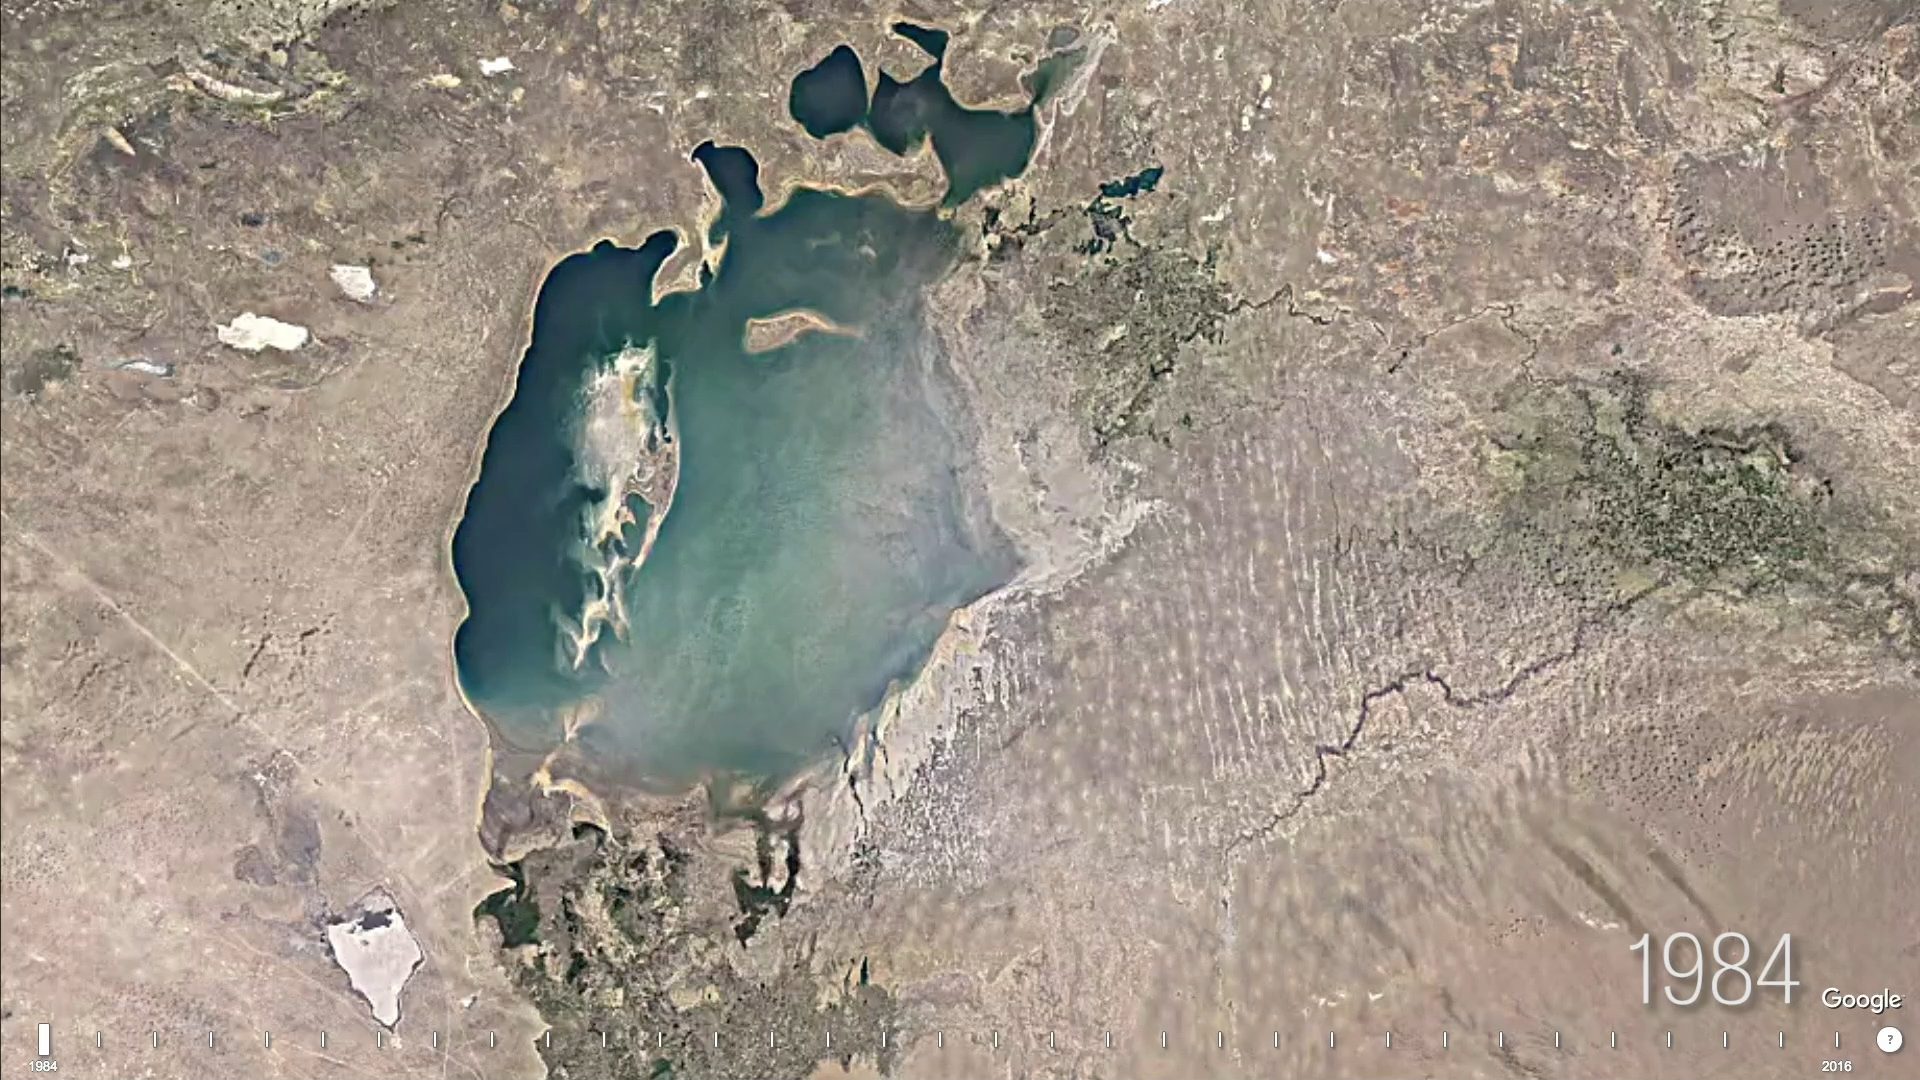
The Aral Sea, border of Kazakhstan and Uzbekistan, 1984–2016.
Inefficient cotton irrigation practices divert most of the inflow from the sea’s two source rivers. As the lake dries and salinity increases, many in the area struggle to find drinking water. This along with respiratory health problems—caused by dust storms riddled with pesticides—have led to unusually high mortality rates for the people of this area.
Unlike the Aral Sea, Lake Mead is a reservoir. It is created by the Hoover Dam, which pools Colorado River water in a basin on the border of Nevada and Arizona, forming the highest-volume reservoir in the US. However, the future of this reservoir, a water supply for over twenty-five million residents, is also threatened.
Just below the surface of Lake Mead, two pump stations intake lake water and, through a series of high-powered electrical pumps, draw an average of six hundred million gallons per day to the sprawling metropolis of Las Vegas. Without this water source, it is unlikely that this city—surrounded by desert—could have tripled in both area and population over the last thirty years.
Our time-lapse begins in 1984. Lake Mead has just reached full capacity, with its surface approximately 1,200 feet above sea level and over-abundant water stores bursting over the crest of Hoover Dam. The reservoir falls and rises with inflow-outflow fluctuations over the next decade, and in 1999, it nearly reaches full capacity again.
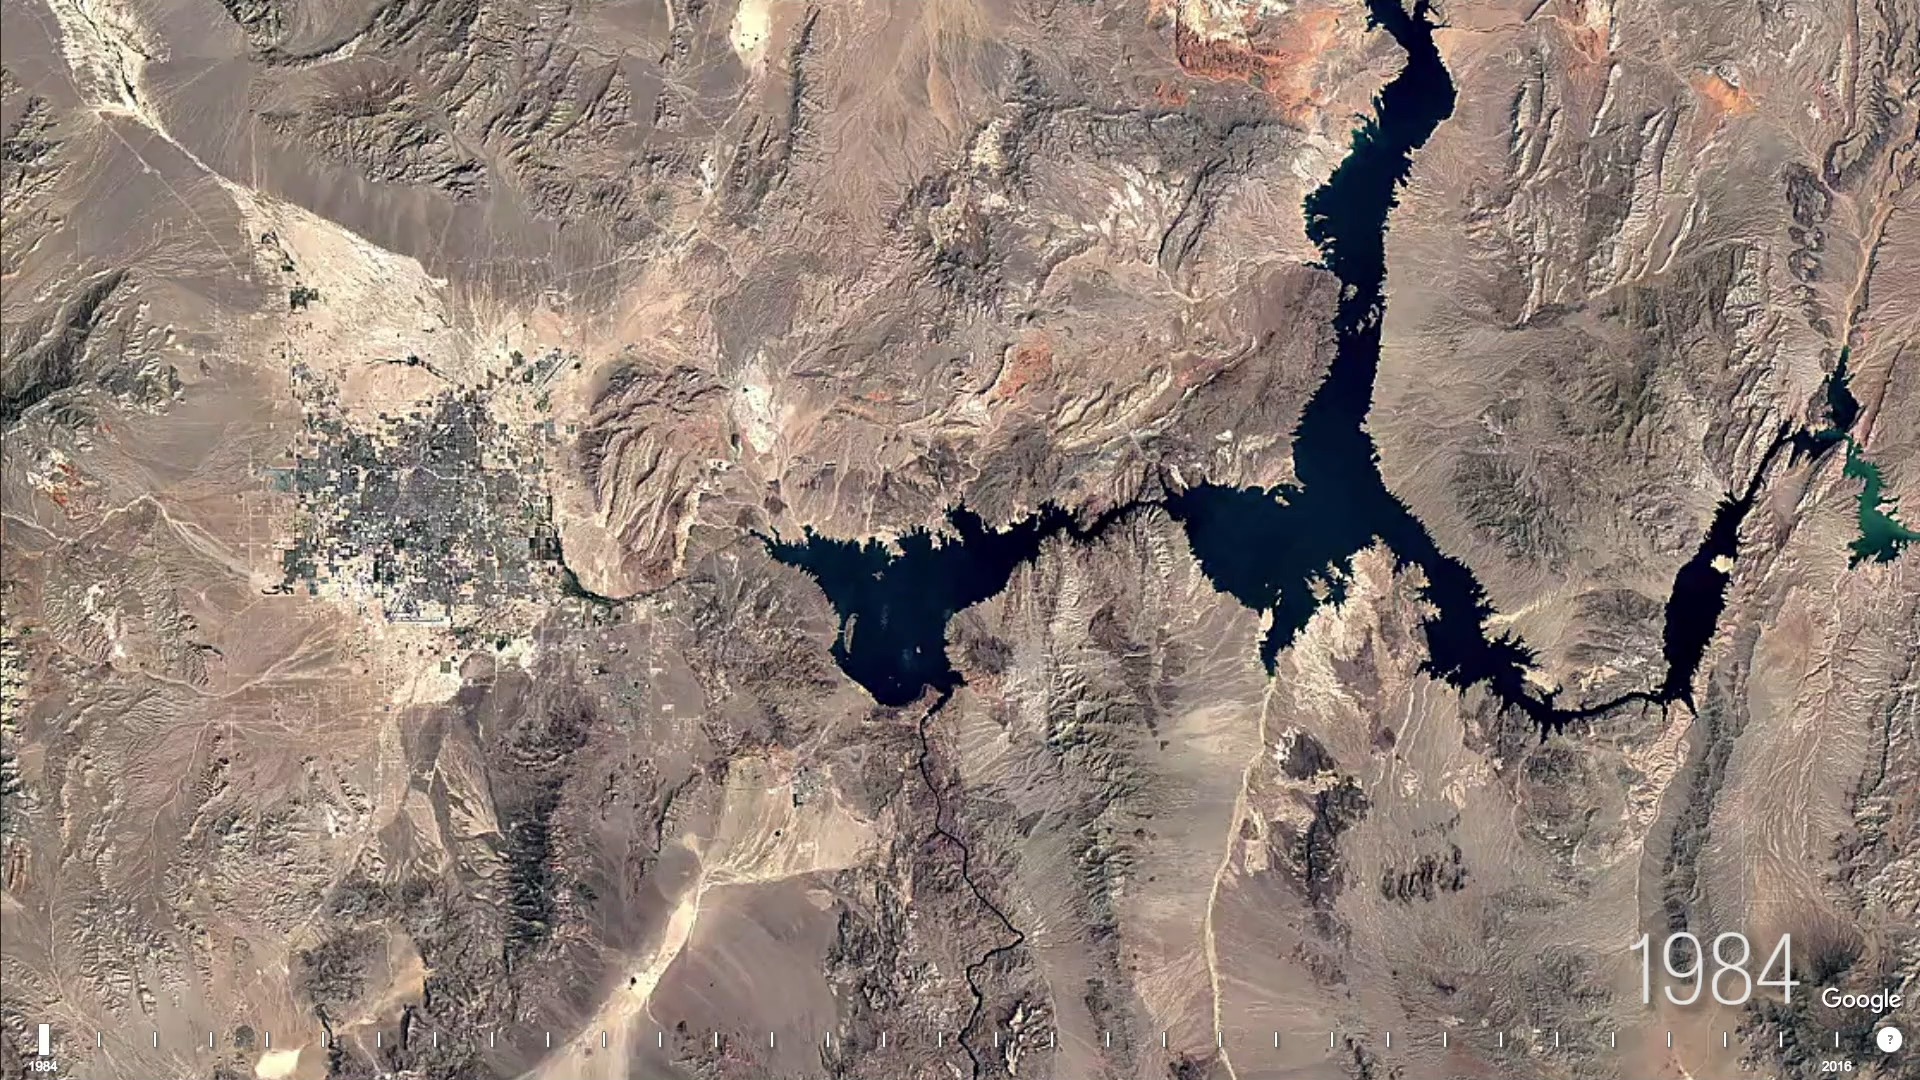
Lake Mead and Las Vegas, Nevada, 1984–2016.
Years of successive drought and a continuously expanding Vegas population have visibly impacted the lake level, which has dropped to 1,086 feet. Lake Mead sits at 50 percent of its capacity and is nearing its lowest surface level since the construction of the dam.
When the surface reaches 1,000 feet, the two existing pump stations will no longer be operational. The solution? The construction of a third, $650-million low-lake-level pump station. Set to become operational in 2020, this new pump will draw water from the reservoir even when there is not enough flow to allow Hoover Dam to spill, worsening drought conditions downstream.
Pat Mulroy, who was the general manager of the Southern Nevada Water Authority from its inception in 1991 until she retired in 2014, has said, “We all recognize and identify ourselves as citizens of a community, and we identify ourselves as citizens of a state, and we identify ourselves as citizens of a nation—we never identify ourselves as citizens of a watershed.”
Seven US states and Mexico have the right to use 16.5 million acre-feet of water from the Colorado River each year. Half of this amount is expected to be available in the coming years.
Concrete
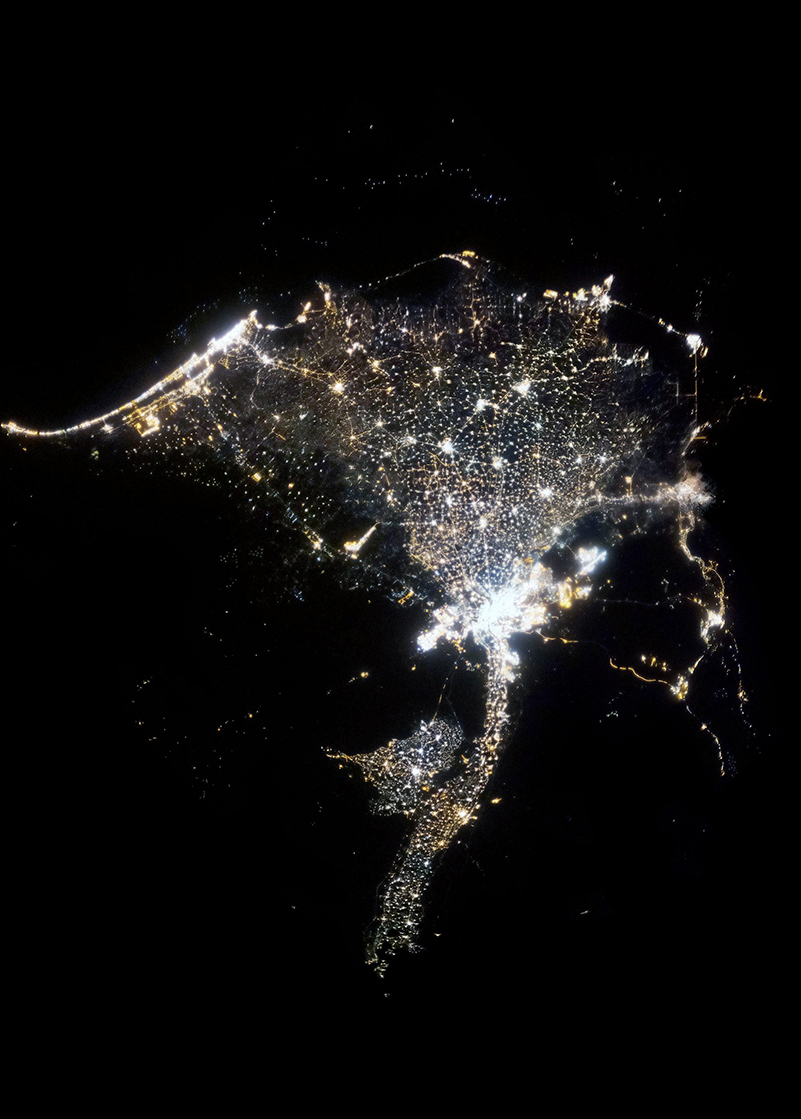
Las Vegas is not the only city struggling to keep pace with a rapidly growing population. In every country, every state and province, cities are expanding, rapidly.
In 1949, the world’s most populous nation, China, was distinctly agrarian and rural, with only 10 percent of its people living in cities. By 2008, over 50 percent of the world’s population called an urban area home; China followed shortly behind with a majority of its citizens living in urban areas by 2011.
Higher urban populations meant that roads, malls, high-rise apartments, schools, and hospitals needed to expand in every direction. In 2017, China produced more concrete than the rest of the world combined. Now the nation holds six of the world’s thirty-one megacities (defined as ten million people or more).
In 1984, at the beginning of our time-lapse period, the Chinese city of Shanghai had a core urban area of about 300 square kilometers, tucked along a bend of the Huangpu River. To both the east and west, agricultural land surrounded the city.
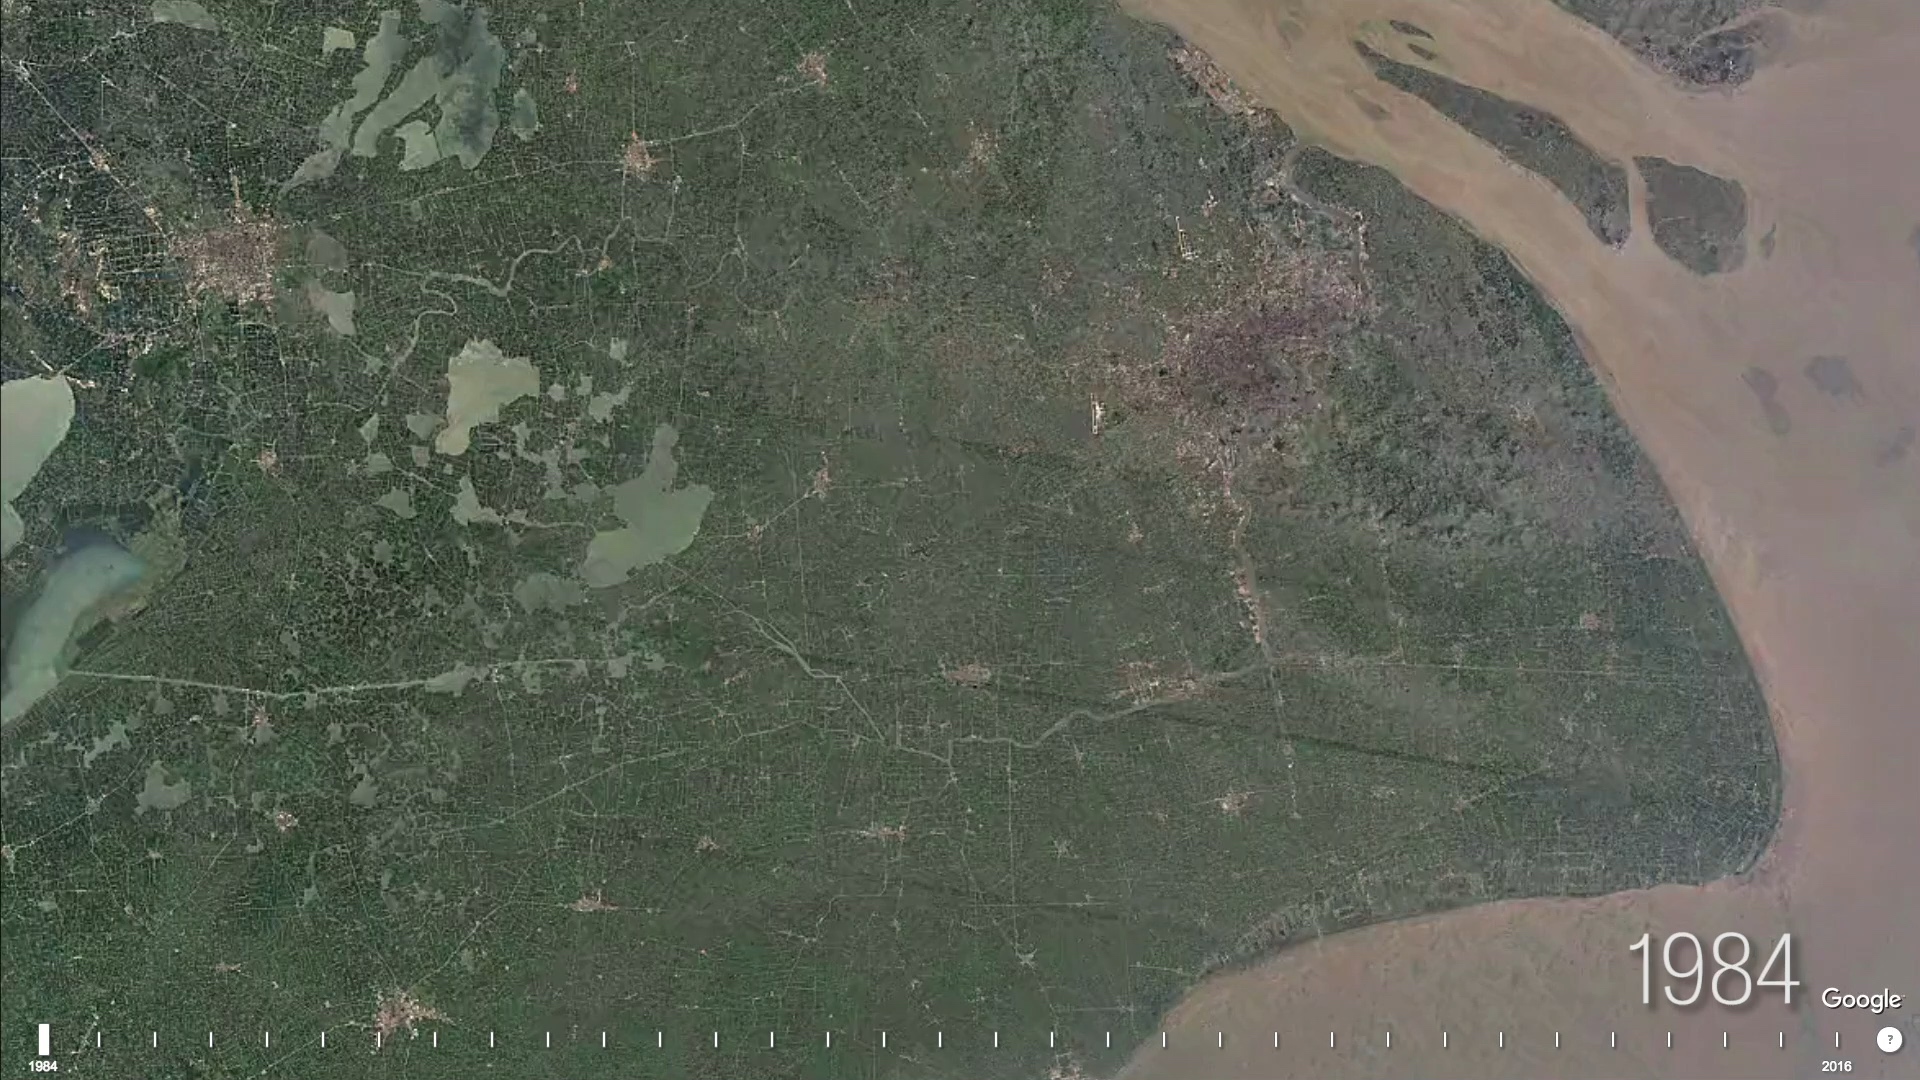
Shanghai, China, 1984–2016.
The growth is most pronounced in the early years of the twenty-first century, as nearly all farmland is replaced with a concrete grid, all the way up to the airport constructed on the edge of the Yellow Sea. Now, with an urban area exceeding 1,300 square kilometers, it is difficult to distinguish Shanghai from neighboring cities.
Sand
For the island of Singapore, the third-most densely populated country in the world, geographic barriers are hardly a deterrent to urban expansion.
Land reclamation, the process of using sand, dirt, or concrete to expand land mass into ocean or marsh areas, has been prevalent in this island nation since the early nineteenth century, when Englishman Sir Thomas Raffles landed in Singapore. His aim was to develop a strategic port on the island to challenge Dutch dominance of the region. He enlisted Chinese, Malay, and Indian laborers to tear down a nearby hill and use the dirt to fill a swampy mangrove forest on the southwest bank of the Singapore River where it met the sea. With this area protected from flooding, construction of a bustling port town began, making Singapore an attractive stop for merchant ships. The nation began to develop and industrialize.
Spurred by the success of its first reclamation project, and with little of its own dirt available, Singapore has since turned to sand as its primary means for expansion. After dredging all of the available sand in neighboring coastal waters, the country has become the world’s largest importer of sand, bringing in tens of millions of tons annually. In the last fifty years, it has expanded its area by 22 percent.
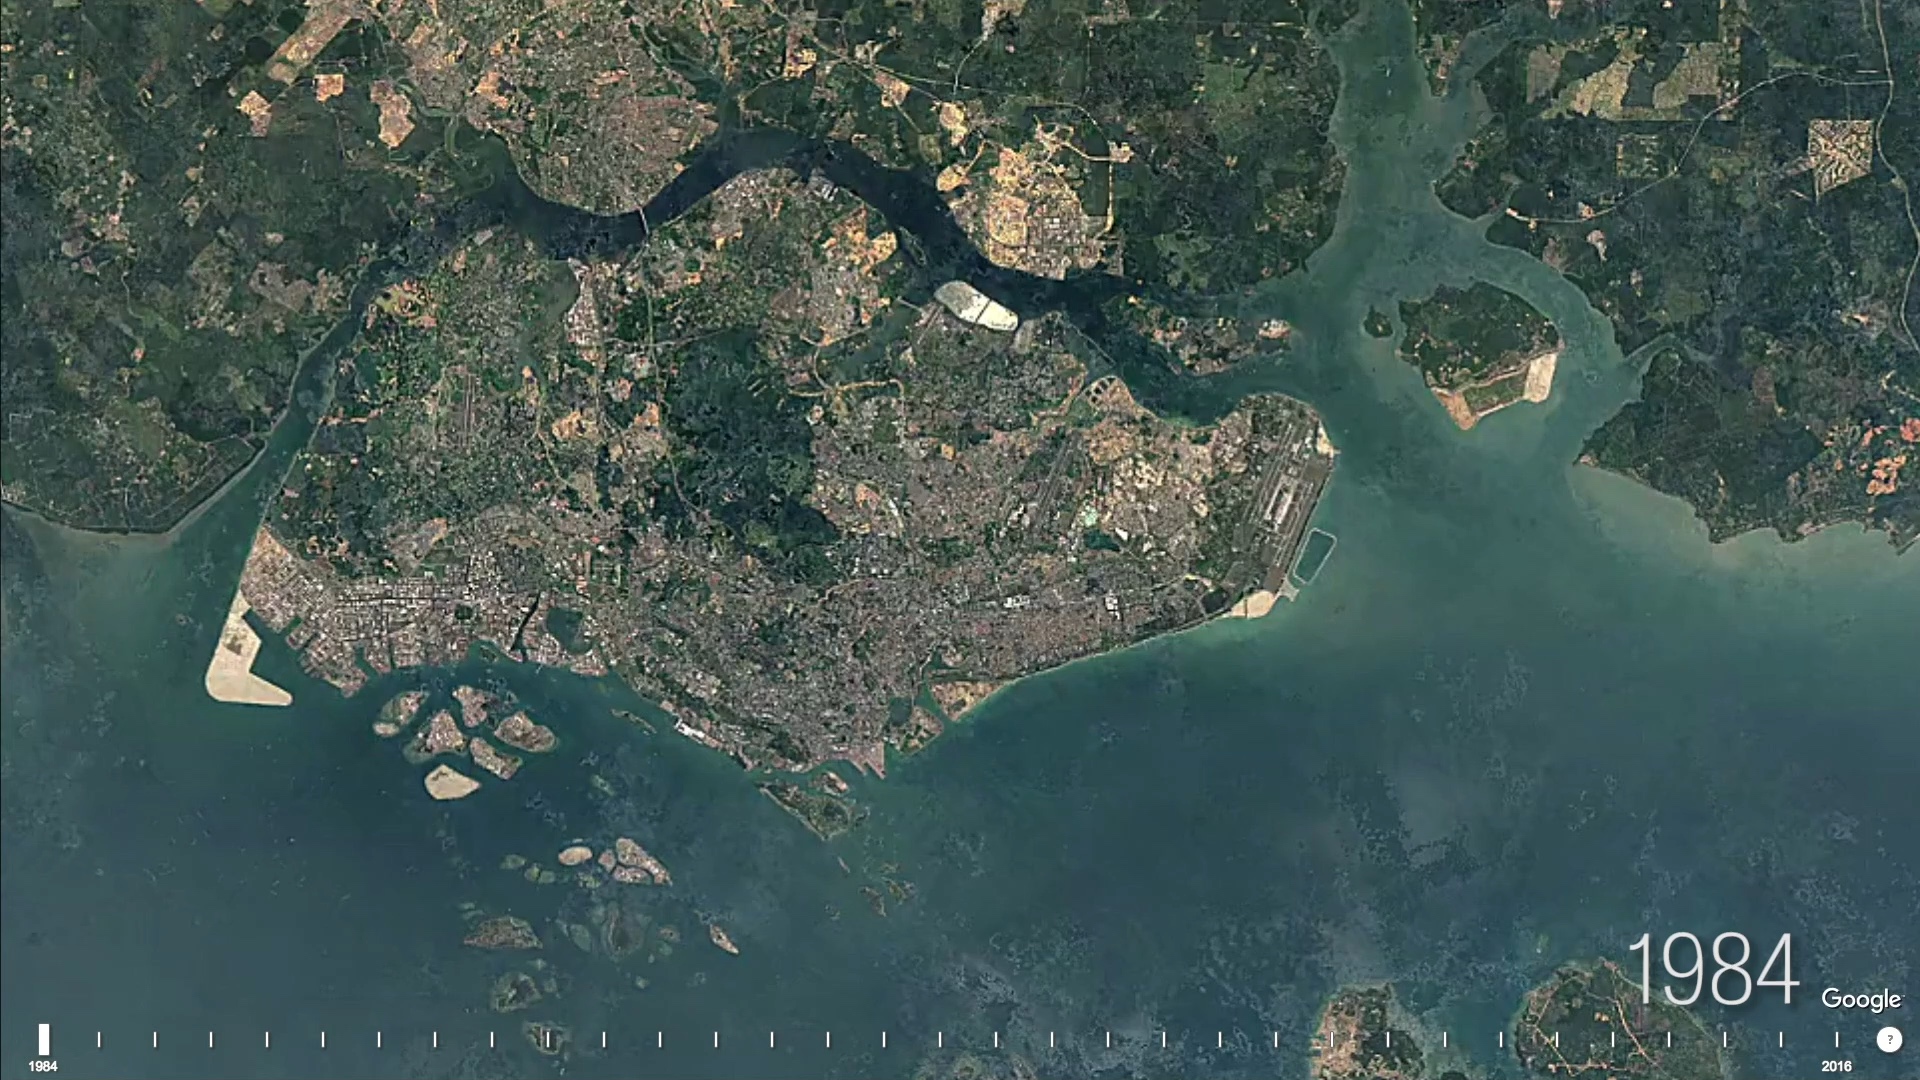
Singapore, 1984–2016.
The land that is reclaimed, primarily dredged from coastal rivers in Cambodia, has become the literal foundation of residential communities and tourist attractions, such as the Marina Bay Sands Hotel and neighboring Gardens by the Bay. The most significant reclamation, the Jurong Island oil refineries of the southwest part of the island, also rest on sand dredged from hundreds of miles away where it once held together the delicate roots of mangrove trees.
Oceans
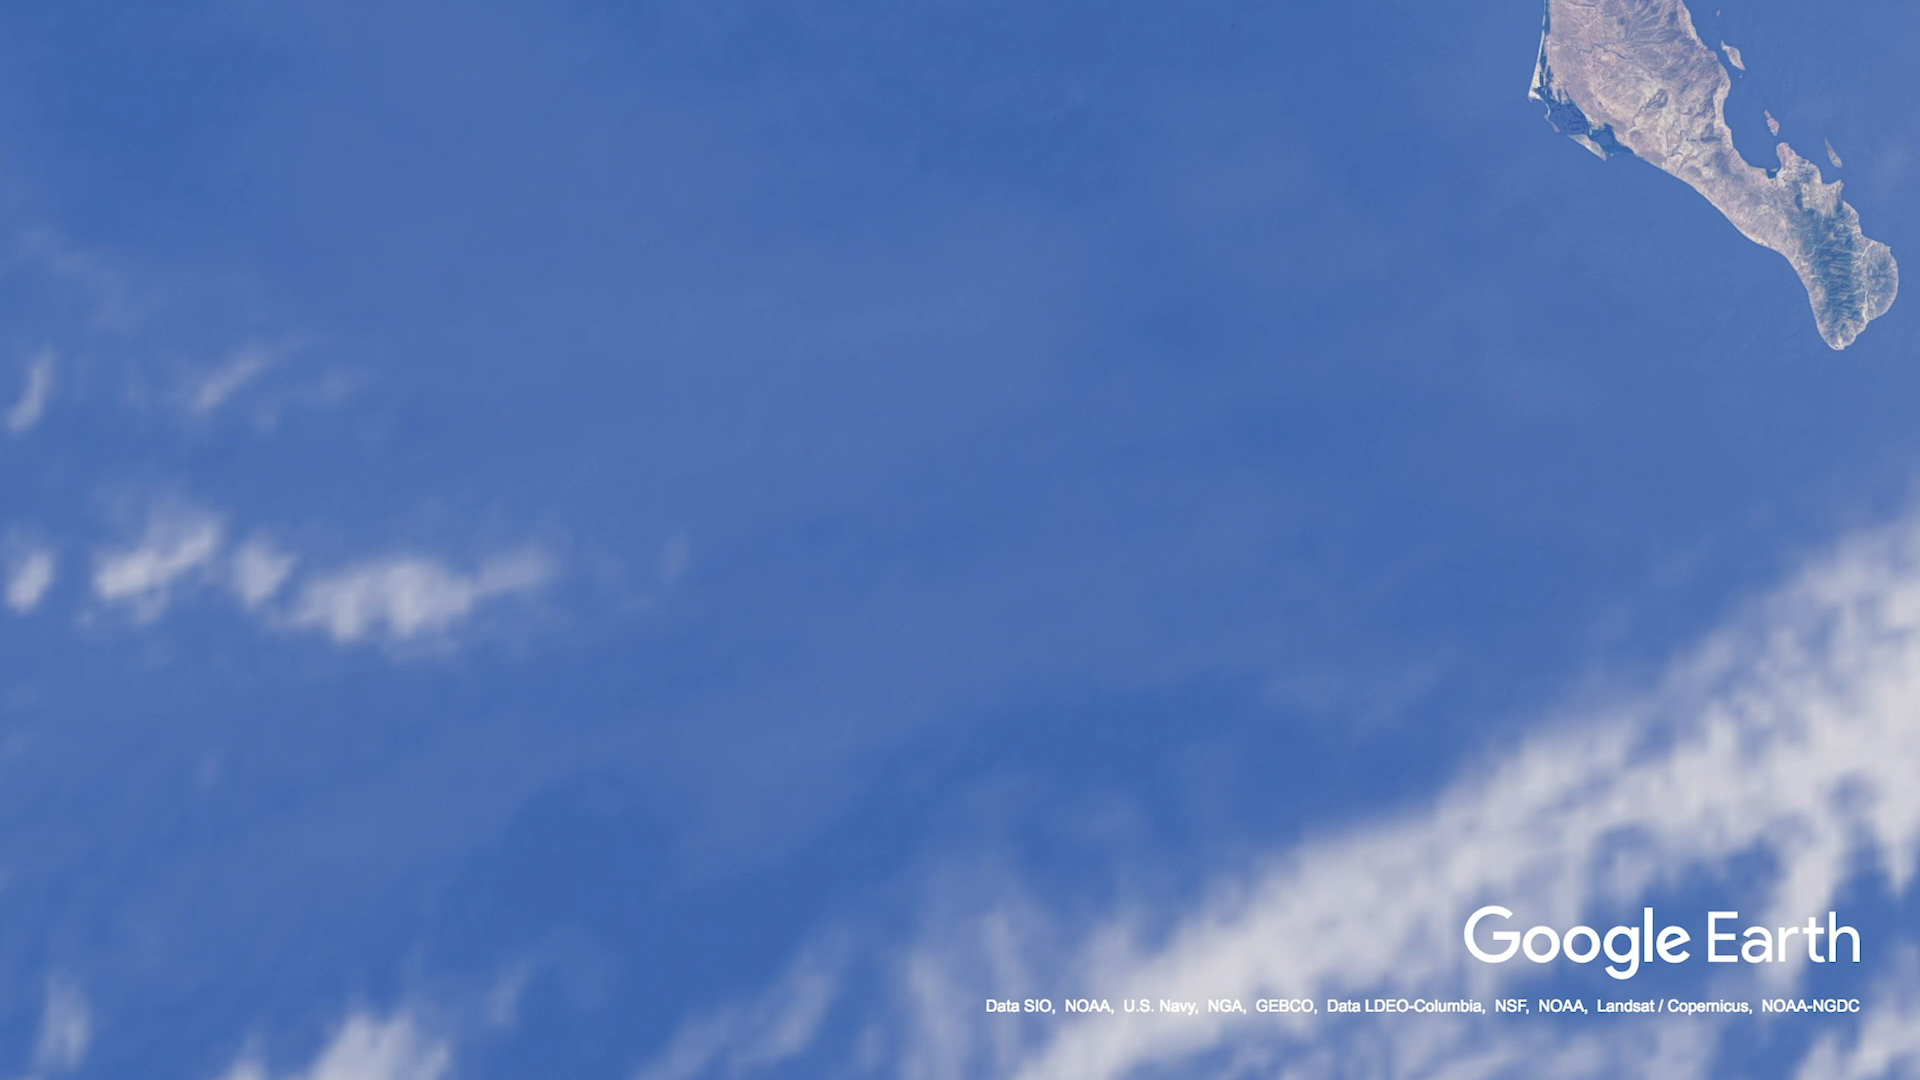
In 2009, journalist Danny Sullivan went looking on Google Earth for the Great Pacific Garbage Patch, a swirling island the size of Texas made mostly of small floating pieces of plastic. He was confident it would be visible from space.
He found no plastic and no ocean surface. Seventy-one percent of Earth’s surface is covered by oceans. When showing these areas, Google Earth uses a blue color in shades and textures that reveal the topography of the ocean floor. The surface is invisible. An e-mail exchange with one of Google Earth’s project managers confirmed for Sullivan that there were few satellite images to be found in relation to the actual waters of the sea.
Landsat and other imaging satellites keep their focus on areas that are inhabitable by humans and resources that can be readily documented and analyzed. New technology will likely be required to see just beneath the ocean’s surface, where the plastic floats. When that technology is available, it will offer a way to raise awareness and stimulate cleanup efforts.
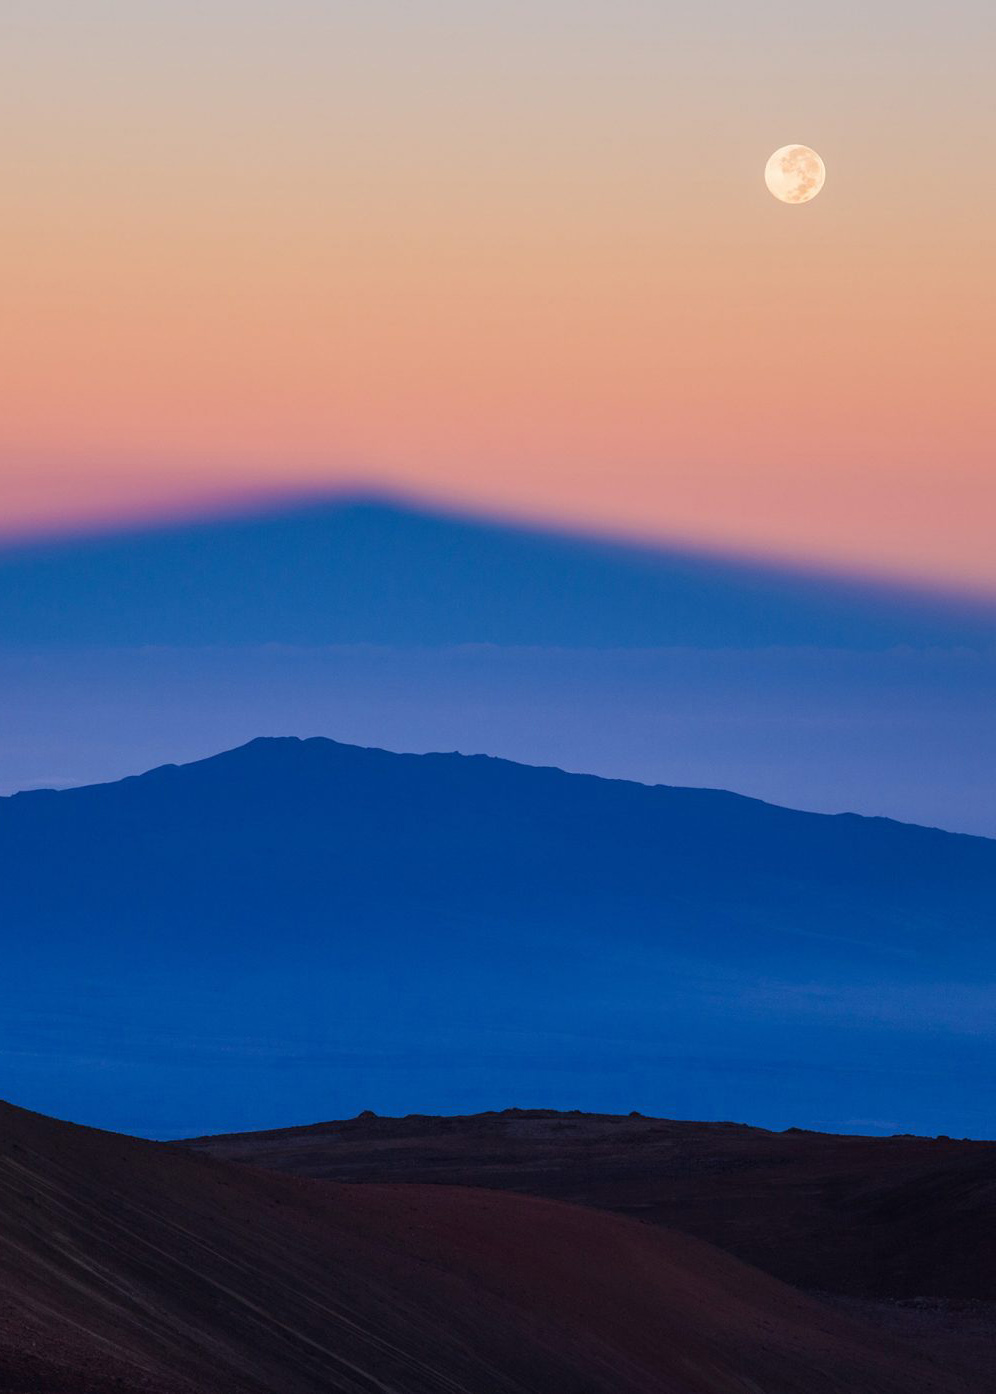
Two Orbital Perspectives
From a lunar perspective, our planet is still pristine and whole, shimmering bright blue in the black emptiness of space. But zoom in closer and you’ll see vivid scenes of human impact.
Because of space technology, we have a clearer picture than ever of both the state of our planet and our place in the broad universe. Secretary of the Interior Stewart Udall saw both perspectives: one shows us an image of our shared home; the other shows the profound consequences of our impact on the planet.
If this technology has revealed anything, it’s that the solutions to urgent environmental problems will not come from space. No, the solutions must be grounded, starting here, with the earth that we stand on.
Related Stories